

Cogito 7 – Freedom, equality, fraternity and culture(s)
10 July 2019
Regulating Insurance in Europe: a Frustrated Ambition
18 December 2019
Drawing on his research on the structure of remuneration in the financial industry and on a collective project underway studying the evolution of inequalities in ten countries, Olivier Godechot, CNRS Senior researcher, codirector of the MaxPo, shows that the decline in financial activity following the crisis and the regulation of the sector did not necessarily reduce remuneration in finance and, consequently, the level of national wage inequality.

Occupy Wall Street March 16, 2012. Crédits image : CC BY-SA 2.0. Michael Fleshman
Ten years ago, the bankruptcies and bailouts of a large number of banks and insurance companies rocked the global economy and led to much reflection about the causes of the crisis. The harmful role of bonuses, and their continuation throughout the crisis, caused public outrage, spurring the Occupy Wall Street movement in the fall of 2011. The movement denounced, among other things, the influence of finance and its role in increasing inequality.
Inequalities preexisting the crisis
These questions inspired a series of academic studies in the early 2010s that confirmed the leading role of the financial sector in increasing inequality. Thus, throughout the 20th century, the US financial sector paid its employees better than other sectors. This sectoral advantage, which changed over the period – reaching +50% in the mid-2000s – played a role in wage inequality. The breakdown of these inequalities by income group shows that growing income among the top 1% in the United States between 1997 and 2005 mainly benefited people working in finance. Similar phenomena occurred in both France and the United Kingdom.
However, these works – published at the beginning of the 2010s – focus on wage developments before the crisis and do not analyze subsequent developments, for lack of sufficiently detailed data.
The reduction in financial activity and adoption of new regulations – particularly on monitoring remuneration – could have led to a decline in financial remuneration and a consequent reduction in inequality.
Factors in bonus reductions
As figure 1 shows, the volume of transactions on national stock exchanges, which experienced very strong growth during the 1990s, fell sharply after the 2008 financial crisis.
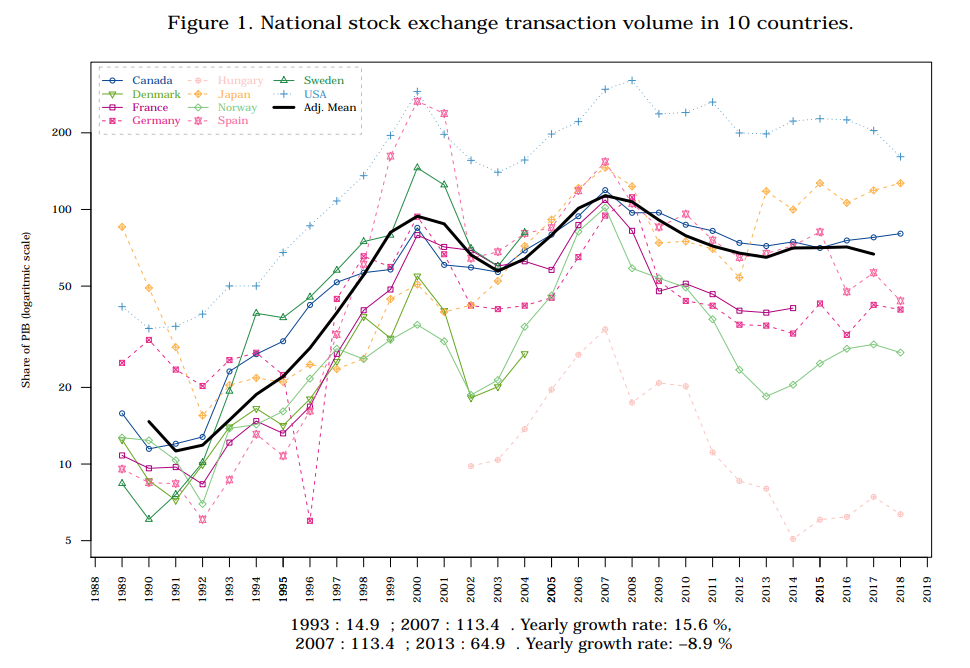
This lower activity, combined with the recapitalization of banks, losses related to the liquidation of bad loans, and the reduction in income from financial intermediation, significantly reduced the profitability of large banks, impacting the budget allocated to bonus payments.
Furthermore, in order to prevent future crises, financial regulatory institutions proposed new measures to limit risk-taking: increase the equity capital required to carry out financial activities, outsource the riskiest activities and, in response to the bonus scandal, regulate remuneration. In 2009, the G20 Financial Stability Board (FSB) called on banks to adopt these good compensation practices over the long term. For example, it recommended a rebalancing of remuneration in favor of fixed salaries and a system of deferred bonuses indexed not only to profits but also to risks, and even a system of penalties in the event of losses. The United States and the European Union adopted divergent approaches to implementation. In 2014, the United States introduced the Volcker rule, which limited banks’ ability to carry out transactions on their own account, but little was done to regulate remuneration. On the other hand, the European Union has not yet adopted the equivalent of the Volcker rule, but adopted the FSB’s recommendations on remuneration in 2010 via the CRD III Directive. Under pressure from the European Parliament, the EU went even further by introducing a bonus cap of 200% of fixed salary in 2013 (CRD IV Directive).
A true decrease in bonuses?
The collection of data on remunerations in finance, albeit a partial one, offers significant insight into their state before and after the crisis. Figure 2 shows the vertiginous evolution of average bonuses on Wall Street since the 1980s. It is certainly worth noting that the 2008 crisis led to a halving of bonuses in the two consecutive years. However, the bonuses were remarkably resilient and quickly recovered to reach levels above the 2001 peak, and in 2017 almost reached the 2006 all-time high.
Figure 2. Evolution of bonuses and number of employees on Wall Street
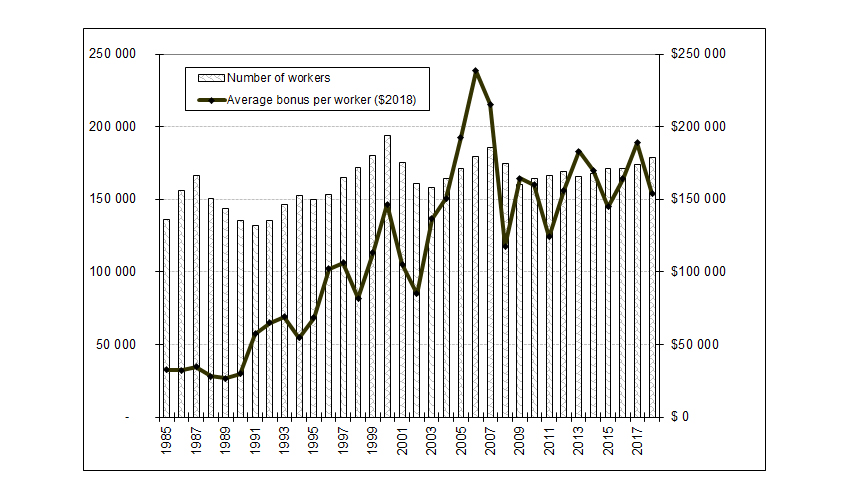
Reading: In 2018, the 175,000 Wall Street employees (left scale) averaged $ 150,000 in annual bonuses. Sources: New York State Tax Controller
Figure 3 shows the evolution of the ten largest remunerations in four French banks on the basis of their social reports. These are remunerations paid to “market specialists”, i.e. a very small elite of trading, trading room or investment banking team leaders. During the 1990s and 2000s, these remunerations increased at a spectacular rate, rising in the case of Société Générale from 280,000 euros at the end of the 1970s to nearly 8,000,000 in 2007, for 2006 performance. Losses related to the Kerviel affair and the subprime crisis, both of which occurred in 2008, reduced these remunerations by a factor of four. However, even after this decline, wages remained high and started rising again. In addition, the implementation of the European bonus cap in 2014 did not result in a significant reduction in remuneration in these two banks. Variable salaries for employees in market activities certainly fell by 40% between 2013 and 2014. But their fixed salaries increased by 73% at Société Générale, and 52% at BNP. This bonus limitation ultimately did little to moderate bonuses, at least in the short term.
Figure 3: average earnings of the ten highest paid employees from 1978 to 2018 in constant euros
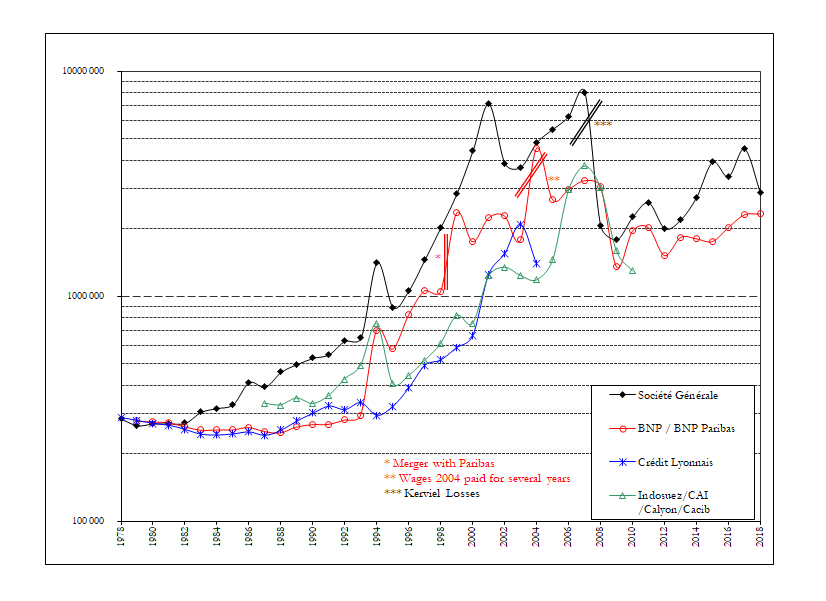
Reading: in 2007 (for the year 2006), the ten best paid employees of Société Générale received an average of 8 million euros (euro 2018). Source: social reports
One might describe the glass as half full or half empty. We can conclude from this first examination that financial compensation significantly fell in the aftermath of the crisis (more because of the decline in financial activity than the compensation regulation), or on the contrary, that it remained very high over the period, and even higher than compensation in other sectors.
The impact on inequalities
By using administrative data on nine countries (France, Denmark, Norway, Sweden, Canada, Germany, Spain, Hungary, and Japan) developed as part of the collective COIN project (Tomaskovic-Devey et al. 2017), and the results of the CPS survey for the United States it is possible to assess the impact of financial euphoria and crisis on national wage inequality. First, let us examine the evolution of wage inequality in ten countries (Figure 4). As figure 4 shows, the wage share of the top 1% consistently increased from the early 1990s to the 2008 crisis at an annual rate of +2% per year.
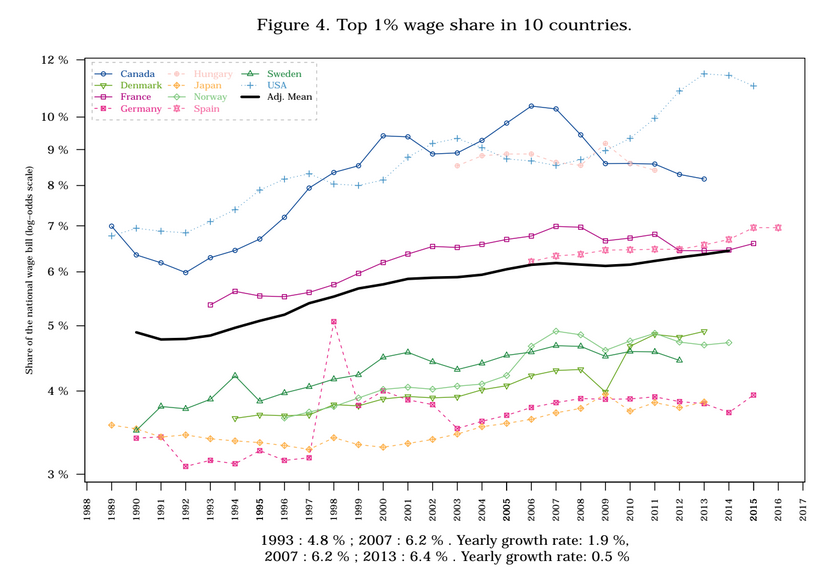
However, the evolution of wage inequalities after the crisis is less well known. Inequality in the sample generally fell (particularly in Canada, Sweden, France and Norway), except in Denmark and perhaps the United States.
To what extent was finance responsible for these developments? Before the crisis, finance was a major driver of increasing inequality. For example, in Sweden, half of the increase in the top 1% share went to employees in the financial sector, as did 45% in France, 36% in Denmark, and a fifth in the United States, Germany, Canada, and Norway. Finance was negatively correlated with increasing inequality in Hungary and Japan – two countries with smaller increases in inequality.
Contribution of finance to the evolution of inequalities before and after the crisis
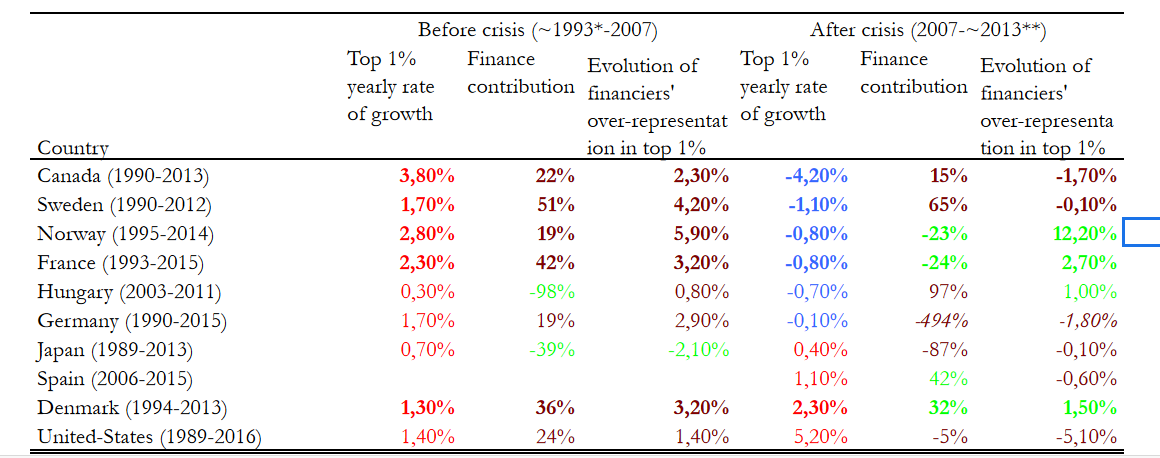
Reading; In Canada, the share of the top 1% of wages in the Canadian payroll grew at a rate of 3.8% per year between 1993 and 2007.
Finance contributes 22% of this increase. The overrepresentation of financiers in the top 1% is growing at an annual rate of + 2.3% per year. Between 2007 and 2013, the share of the top 1% decreases at a rate of – 4.2% per year, finance contributes 15% and the overrepresentation of financiers decreases at a rate of -1.7% per year
* or subsequent
** or earlier
source COIN (see appendix) and survey CPS (United States)
The increasing overrepresentation of financiers among the top 1% – a quasi-general phenomenon (with the exception of Japan) over the entire pre-crisis period, is another way of measuring this phenomenon, as shown in the figure below.
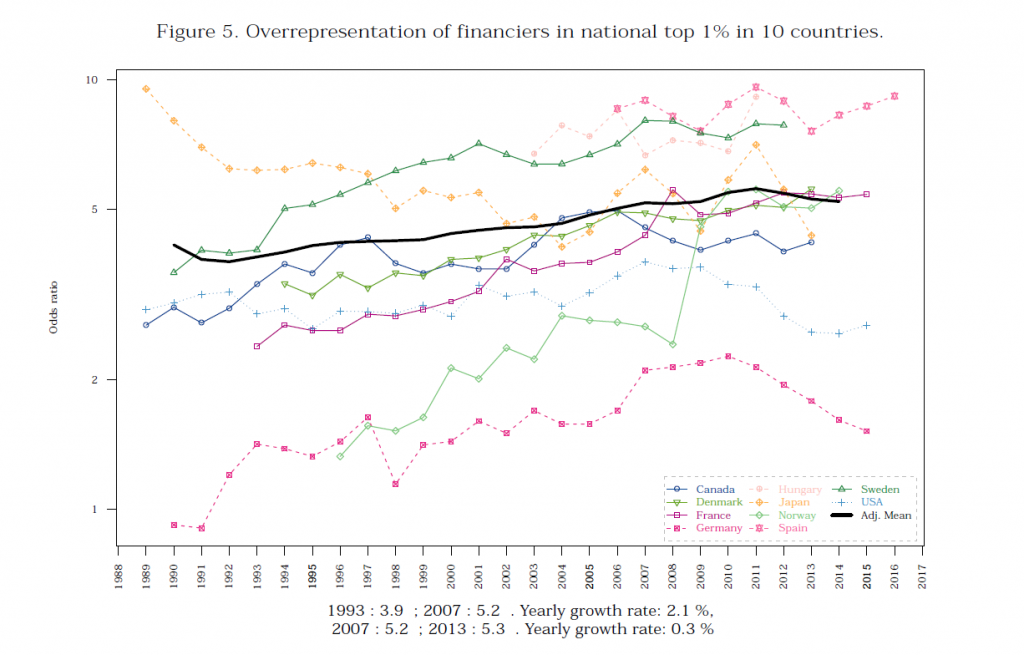
After the crisis, the role of finance differed from one country to the next. In Canada, Sweden, and Germany, the maxim of financial euphoria – more finance, more inequality – effectively reversed to: less finance, less inequality. But this was not the case in France and Norway, where finance continued to contribute to growth, and where financiers continued to cluster at the top of the national wage hierarchy. In countries where inequalities continued to grow, the role of finance also differed from one country to the next. It remained the driving force in Denmark. By contrast, in the United States and Japan, finance contributed less to growing inequalities than other sectors.
While the financial crisis might have led us to believe that its excesses lay in the past, this examination shows that financial wages declined after 2008, but also remained very high.
In a previous book (Wages, Bonuses and Appropriation of Profit in the Financial Industry: the Working Rich), I discussed some of the reasons for sticky-remuneration. Because gains are intended and pursued, it is easy to assign responsibility for them and reward them. On the other hand, because losses are never sought, they are easily seen as resulting from bad luck and are less heavily penalized. These structural factors may explain why it is so common for banks to continue to pay substantial bonuses to operators who have racked losses (considered cyclical), for fear of seeing their top talent join the competition.
Diverging national results
Our second finding is that countries after the crisis showed striking contrasts. While the decline in financial activity and inequality were correlated in Sweden and Canada, financial wages continued to be a driver of rising inequality in France, Denmark and Norway.
This divergence in post-crisis developments probably reflects differences in how governments and banks managed them (Woll, 2014), in the financial specializations of different countries, and in norms surrounding wage inequality. In the United States, where finance significantly contributed to rising inequality in the second half of the 1980s, inequality norms gradually spread to other sectors, and particularly to big tech, somewhat relativizing the financial sector’s role. In Sweden, on the other hand, market finance proved to be an unequal niche in an economic structure that remains “social-democratic”. The level of national inequality, which is still low, accordingly varies with the rhythms of financial activity. Finally, in Norway, the financial sector was until recently underdeveloped in market activities and focused on retail banking activities, yielding a relatively egalitarian remuneration structure in finance. Only recently has market finance developed there, with the emergence of activity around sovereign wealth funds. Norway then quickly converged with other countries in terms of the concentration of financiers in the wage elite.
These few contrasting elements are just the first steps to further exploring the diversity of unequal trajectories after 2008.
- Bakija, Jon, Cole Adam, Heim Bradley T. , 2012 – Jobs and income growth of top earners and the causes of changing income inequality: Evidence from US tax return data. Working Paper
- Philippon, Thomas, Reshef Ariell. 2012. Wages and human capital in the US finance industry: 1909–2006, The Quarterly Journal of Economics
- Godechot Olivier, 2017 – Wages, Bonuses and Appropriation of Profit in the Financial Industry: the Working Rich, Routledge
- Godechot Olivier, 2012 – Is finance responsible for the rise in wage inequality in France? , Socio-Economic Review et Bell Brian, Van Reenen John , 2014 – Bankers and their bonuses, The Economic Journal
- Woll Cornelia, 2014. The power of inaction: Bank bailouts in comparison. Cornell University Press
COIN (Comparative Organizational Inequality Network) is a consortium of researchers led by Don Tomaskovic-Devey (2017) that studies organizational inequalities based on employer-employee administrative data on wages. We use exhaustive data for Canada (Statistics Canada), Norway (Statistics Norway), Sweden (Statistics Sweden), Denmark (RAS, IDAN and BES), and France (DADS in the private and semi-public sector). For Hungary (NMH Wage Survey), the sample covers half of the employees. In Japan (Basic Wage Survey), Germany (IEBS), and Spain (Continuous Sample of Working Histories (CSWH) and tax records), the samples cover 4 to 6% of the employed population. In Germany, reported wages are capped at a relatively low level (at the level of the upper decile threshold). We imputed the high salaries with the available information. However, this technique is imperfect and some imprecision remains. In Japan, salaried executives are not included in the data, and this might reduce the level and evolution of inequalities.
Learn more: Tomaskovic-Devey Donald et al.. 2017. « The Comparative Organizational Inequality Network: Toward an Economic Sociology of Inequality », economic sociology_the european electronic newsletter, vol. 19, n°1, p. 15-21.
[/alert]


