

Frugal city: a 3rd way between “business as usual” and decline?
25 October 2018
Distributing trade maps: the gravity equation
26 October 2018
 The result of collaboration between the Center for History and the médialab, RICardo (Research on International Commerce) is a project devoted to trade between nations since the beginning of the industrial revolution through the eve of World War II (1800/30 – 1938). Its website provides a database, visualization tool, source code, and metadata. The economic historian Béatrice Dedinger and research engineer Paul Girard lead the project. Below they discuss its major points and contributions to the research community.
How was the RICardo project born?
Béatrice Dedinger: The idea was born at the beginning of the 2000s to respond to the needs of economic historians working on trade globalization. At the time, when researchers needed data for their work, they had to develop their own database and often duplicated work that other researchers had already done. In addition to being inefficient, this approach yielded spatially and temporally limited databases. The initial objective was therefore to create the most exhaustive database possible and make it freely available to all researchers. This took a lot of time and the project experienced a number of ups and downs. It was even suspended for a period of time because of a lack of resources. By the time I was able to pick it back up in 2012, the digital revolution had opened new opportunities and the médialab had been created.
Paul Girard: I was introduced to Béatrice by a researcher, Guillaume Daudin, with whom ![Portrait of David Ricardo by Thomas Phillips [Public domain], via Wikimedia Commons](https://www.sciencespo.fr/research/cogito/wp-content/uploads/2018/10/Portrait_of_David_Ricardo_by_Thomas_Phillips.jpg "Portrait of David Ricardo by Thomas Phillips [Public domain], via Wikimedia Commons") I was developing a project that also touched on the history of international trade (TOFLIT18). He told me that Béatrice wanted to create an online database. We set out to build one and went well beyond creating a few webpages. I proposed to Béatrice that we create a real tool to explore data and visually demonstrate the database’s originality and richness.
I was developing a project that also touched on the history of international trade (TOFLIT18). He told me that Béatrice wanted to create an online database. We set out to build one and went well beyond creating a few webpages. I proposed to Béatrice that we create a real tool to explore data and visually demonstrate the database’s originality and richness.
Béatrice: we had to invent and innovate, because no product like this existed. Six additional years of work and funding from Sciences Po’s Scientific Advisory Board were needed to finalize the database and create the visualization tool. In December 2017, coinciding with the bicentennial of the publication of David Ricardo’s Principles of Political Economy and Taxation, the RICardo database was opened to the public.
Paul: the médialab is committed to the principles of open research and we would like everyone to benefit from our research. The tool is freely accessible online, and the source code for the visualization software, as well as all the source data and cleaning and aggregation scripts are accessible via file-sharing on github. Most importantly, this transparency allows users to verify our work!
What kind of data can be found in the database?

Click on the image for detail
Paul: It includes exactly 396,062 lines describing annual totals in Sterling Pounds of imports and/or exports between the countries of the world from 1787 to 1938.
Béatrice:the RICardo database describes, over a period of over one hundred years, the geographical distribution of countries’ trade, but it does not include data by product. We regularly receive requests for the latter, but what we are offering is already significant since the decade-plus of work we put into it allowed us to build a very solid database including over 400,000 data points. Just creating this database involved many operations: finding and digitizing archives; transcribing the data into spreadsheets; converting them into a common unit because they were naturally expressed in different currencies – we therefore had to create an exchange rate. We also standardized the names of trading entities that were expressed in different languages and that designated not just countries but also ports, geographical zones, and groups of countries. Finally, we tested and corrected the data. We would also like to note that the bilateral trade data can help address many research questions on the globalization of trade in goods (measurement of the phenomenon, causes, and consequences). 3 - Spitzberg, Billet d'un rouble édité en 1976")
Going back to the database’s content, the series ends with World War II because the succeeding period is covered in United Nations and IMF databases. From a geographical perspective, it catalogues the data of 120 countries, even though this number is not constant over the whole period, for lack of sources, new data integration or data cleansing. Thus, France’s bilateral trade is covered from 1787 to 1938, China’s from 1868 to 1938, and current Tanzania’s only beginning in 1900.
RICardo also provides an overall trade series (each country’s total exports and imports), which enables historical estimates of global trade. Thanks to the website, these estimates can be compared to those of two historians, Federico and Tena, whose work is the global reference today.
You are both involved in the project, but you work in different laboratories. Why such a collaboration, and what are the contributions of the médialab and the Center for History?
Béatrice: Without this collaboration, the project would not have succeeded. At the Center for History we develop expertise on the production of historical data for researchers and PhD students. Meanwhile, the médialab was created to help researchers in the humanities and social sciences get the most out of the troves of data that digital technology helps accumulate. These two missions are entirely complementary. When I contacted Paul, I had general ideas about possible uses for the reams of data I had, but I had neither the skills nor knowledge of issues related to visual exploration.

Click on the image for detail
Paul: That is what interested me about the project. When Béatrice presented it to me, I was working on the contribution of visual explorations in data processing for research. For RICardo, I was able to implement a method developed in the médialab called DATASCAPE. With DATASCAPE, data is explored not only as an analytical and valorization tool, but also as a method for building a body of data. Indeed, creating an effective visual exploration of data requires simultaneous consideration of data structuring, aggregation methods, and forms of visual representation. That all entails constant shifts in perspective between design, data science, and social sciences.
Béatrice: Moreover, while our partnership is at the heart of the project, we tapped other historians, designers, and developers over these years to help us process many questions linked to the project, like the concept of the website and the various visualizations.
Concretely, how can we explore the database?

Click on the image for detail
Paul:‘Exploring’ is the right term to use here. Indeed, the goal of the project is both to help answer specific research questions, and to offer new tools to test questions that have already been asked, elicit new ones, and open the data to a larger audience, especially in academia.
Béatrice : The website was created to facilitate the exploration of data thanks to an immediate visual rendering. Our first objective was to create visualizations of trade data strictly speaking. Three levels of gradual aggregation were chosen:
The first view offers an overall picture of the development of trade between countries at the global level by only considering total trade data. The user can visualize the evolution of global trade and each country’s share. These data allow for the calculation of globalization indicators.
The second view provides a representation of the evolution of a selected country’s bilateral trade over a chosen period. With one click, for example, one can see with whom and to what extent Chile traded between 1844 and 1938. This is the kind of data that economists use in models that analyze the causes of globalization.

Click on the image for detail
The third view focuses on the bilateral level, where one can follow the evolution of trade between two countries over a chosen period. This view’s purpose goes beyond the description of bilateral trade flows. It sheds light on an aspect of trade history that has been underexplored to date: the reliability of trade statistics. By comparing the two values of a same trade flow recorded as an export by one country and as an import by the other, the bilateral view shows inconsistencies in the statistics of two countries on a same phenomenon. These divergences illustrate the complexity of data interpretation, given that the data production context yields different realities.
Paul: We then decided to create another exploration tool that provides a synthetic view of the database, as well as more detailed information on its content and conception: a kind of visual documentation. The ‘metadata’ view is very rich. It shows the level of completeness by tracing the number of included flows and entities each year. It can go back to the source of each recorded flow. It provides a window into the complexity of the this type of database by developing available data annually for the list of trade entities reporting external trade flows. The user can thus note that the database is not “perfect”. It is a choice we made from the very beginning to not downplay the complexity of reality by inventing fictive entities or estimating missing data. The ‘metadata’ view suggests that the researcher use the data with discernment; it also suggests other ways of using the data by more closely studying this complexity.
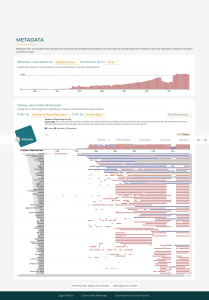
Click on the image for detail
Are any new developments planned?
Béatrice: As the ‘metadata’ view highlights, there are relatively data-poor periods, particularly the 1914-1923 period, which was left out on purpose. This gap remains to be filled by going back to the data-gathering phase. Moreover, we still have a large number of digitized trade archives whose data have not yet been transcribed. A truly complete database has yet to be achieved.
Paul: Another important area of improvement concerns our classification system for trade entities. A political history dimension needs to be added to the data in order to reconstitute the trade of colonial empires and federal states over the whole period.
Béatrice: The idea is to allow the user to explore the trade of colonial empires or isolate the trade of states that will go on to become part of a federal state. Finally, we would like to integrate mapping visualizations into the website.
Paul: It’s a very ambitious plan, because in addition to the political history dimension, it assumes we have historical base maps. We hope that we will be able to find new funding to expand our collaboration to Sciences Po’s mapping studio.
Learn more


