Home>Create a well-being or sustainability index with the students
21 November 2017
Create a well-being or sustainability index with the students

The course “ Measuring well-being and sustainability in the 21st century ”, created and led by Eloi Laurent and Jacques Le Cacheux, is founded upon a twofold innovation, a formal and a substantial one: help the students to go beyond growth as a fundamental unit of economic measure by confronting their points of view in class and online and work with them on new indicators of well-being and sustainability to “count what counts”.
Going beyond the GDP to understand the world’s changes
The course “Measuring well-being and sustainability in the 21st century”, that we conceived and created with Jacques Le Cacheux, is founded upon a twofold innovation, a formal and a substantial one.
Substantially, during its first edition in 2012, it was the first economics class in Europe dealing with the purpose to go beyond growth and GDP via well-being and sustainability indicators. GDP and growth (i.e. the increase of the GDP) remain central notions in economics courses whereas everything indicates they are not fit for the purpose of understanding the world economy and monitor our 21st centuries economies, since growth has yet only a distant link with human well-being and sustainability, which became central. Thus, GDP does not allow understanding the two major crises of the beginning of the 21st century, the inequality and ecological crises, and growth does not enable to solve the issues. We must therefore give our students the good toolkit.
Linking controversies, online and in-class teachings
The formal innovation has consisted in realizing one of the first teachings in flipped classroom of Sciences Po.
During the launch of the course five years ago, we had not written yet the handbook of our course (published in 2015, Un nouveau monde économique – Mesurer le bien-être et la soutenabilité au XXIe siècle, Odile Jacob). The preparatory work on student’ side relied thus entirely on them watching videos accessible via Moodle. With the help of the Notebook SMART and with the precious help of Eric Reuillon, we have registered for each theme of the course corresponding to a modality of well-being (health, education, trust, sustainability, etc.) three videos of around 15 minutes: a “Toolbox” module, which encompasses the main tools of analysis of the topic; a “Datapoint” module, which presents the indicators of reference and their results and an “Online” module, which orients the students towards online resources that they might find useful, and notably databases. We kept the initial videos, but students must in addition of watching the videos prepare the “in-class” courses (one session every two weeks) with the help of the handbook, they therefore come to class prepared for the debates, which are held.
Figure 1 – Schematization of the pedagogical scenario of the course (in French)

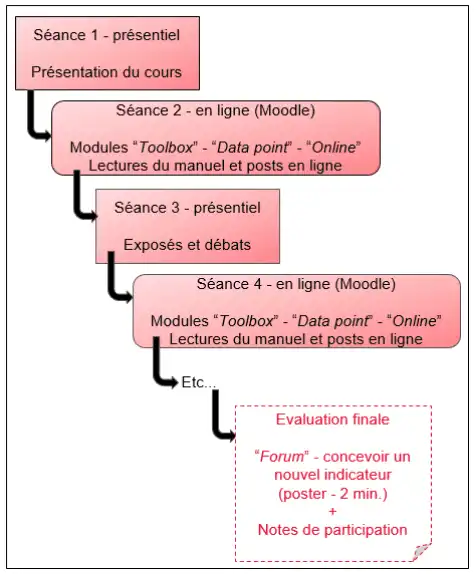
- Class 1 – in-class course – Presentation of the course
- Class 2 – online course (Moodle) – “Toolbox”, “Data point”, and “Online” modules – Readings from the handbooks and online posts
- Class 3 – in-class course – Presentation and debates
- Class 4 – online course (Moodle) “Toolbox”, “Data point”, and “Online” modules – Readings from the handbooks and online posts
- Final Evaluation: “Forum” – conceive a new indicator (poster – 2 min.) + Grades of participation
Indeed, we wanted from the beginning that the course serve as a laboratory for the students, of which the majority of the grade belongs to the realization of a new well-being indicator or of sustainability. Students must invent by themselves a tool of measure, and therefore of intelligibility, of our economic world (we leave them a great freedom of choice of the subject, even if we try to monitor the methodological aspects, some have therefore proposed an international indicator of measure of well-being of children, others an indicator enabling to measure the well-being of international students in Sciences Po, others an indicator of environmental quality of the Parisian districts, etc.).
Along the semesters, we have refined the grading modalities by leaving more space to our desire to innovate. This year, our students received 9 different grades corresponding to seven different exercises, which mixes off- and online, as well as individual and collective work: the final work, the realization of the well-being indicator or of sustainability, can be pursued alone or in pairs, but it must in any case be presented during the last session of the course under the format of a poster (a single slide commented in two minutes allowing in one look the work as a whole), this session called “Forum” allows each student to understand the work led by others along the semester and broaden their knowledge ; participation in class is accompanied by an online participation on the blog of the course (accessible via Moodle), the students realizing a post of blog within a group of 5 to 6 and commenting personally the posts of other groups ; finally, students, by group of 2 or 3 realize in class the presentations (with Powerpoint support) on questions linked to the theme of the day (for instance, on the theme of well-being: “At which level of wealth can we reach happiness ?” or “ How to measure happiness in China today ?”) and, in the same group of two or three, discuss other groups’ presentation.
It is this part of the exercises in class, decisive as in every course in interactive teaching, which led to the most difficulties from our side. When we started, we asked our students to confront their points of view around one or two questions in two rival teams. But this format did not work, even according to the students, since the discussion was focusing on a single aspect and opposed two students only, which was decreasing the interest of such a format as well as its impact on the class. We therefore chose a more classical format, in which in class-sessions are in quasi-totality devoted to the expression of students, in the Sciences Po spirit: one group presents during ten minutes, one group discusses the presentation, we then provide a quick follow-up to ensure that the key concepts are understood, then follows a general discussion. With two dimensions of well being per session, there are therefore four presentations, four discussions and four collective debates per session: there is rhythm, variety and on occasion, controversies!
An app to allow Parisians to choose the place where they want to live
But the great moment of the course is definitely the final session, i.e. that of the forum, in which around forty proposals of indicators are presented at a rapid pace. This year we have had the surprise to notice that one group had created a website and a mobile app to give life to its indicator, which allows Sciences Po students to choose their district of residency in Paris according to their preferences (cost of life, night life, etc. which are essential components of student well being). A piece of work that is simultaneously useful, rigorous, fun and innovative, exactly what we await with curiosity from our students each year.
Eloi LAURENT, OFCE/Sciences Po, Stanford University.