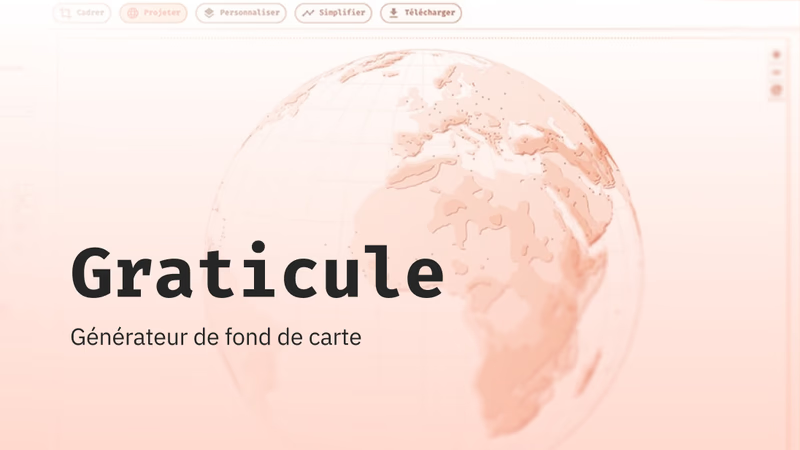
Designed by the Sciences Po Cartography Workshop, the free and open-source thematic mapping tool has been given a new look. Completely redesigned, more powerful and built around a guided workflow, Kha...
One framing, one projection, one level of detail: your basemap is ready to download as PNG or SVG. No account, no installation, no GIS. Graticule suits a hand-drawn geography sketch just as well as an...
This page brings together a selection of resources and tools recommended by the Atelier. It follows the main stages of the workflow: from finding inspiration to processing the data, through to finalis...
The Khartis application adapts to your environment and your working constraints. Whether you use it online or offline, it guarantees smooth local operation, simplified maintenance and complete respect...
In the media as in reports, global warming is usually shown with the same chart: a jagged line of the yearly temperature deviation from a reference period. Yet this chart blurs two notions, absolute t...
Which streets in Hamburg carry the most cyclists, and where do they ride fastest? In this tutorial, you import a file of lines, the streets used by cyclists, and map two pieces of information at once ...
Which countries are the main producers of oil, gas and coal? A single map cannot answer this effectively. In this tutorial, you create a map collection: three maps side by side, one per energy source,...
In which regions of Europe are women more often tertiary graduates than men, and where is it the other way round? Two maps, one per sex, do not tell you at a glance. In this tutorial, you calculate th...
A poverty rate tells you what share of the inhabitants live below the poverty line. It does not tell you how many people are affected. In Seine-Saint-Denis, the two do not tell the same story. In this...
This text was originally published in volume 75 of the Revue française de science politique (2025, 2). It offers a critical, comparative reading of the following three books: - Anne-Laure Amilhat Szar...
The Sciences Po Cartography Workshop designed a number of graphic plates to illustrate Benoît Pelopidas’s book (Repenser les choix nucléaires, la séduction de l'impossible – “Rethinking nuclear choice...