Graticule – Your basemap in 5 steps
One framing, one projection, one level of detail: your basemap is ready to download as PNG or SVG. No account, no installation, no GIS. Graticule suits a hand-drawn geography sketch just as well as an exploration of map projections.
A basemap, straight away
Graticule starts from a framing — a country, a region of the world or free navigation — and hands you a clean basemap, ready to be drawn on or annotated.
A five-step workflow
Frame, project, customise, simplify, download. A linear yet reversible sequence that offers the right setting at the right moment and lets you step back at any time.
Projection as a way of understanding
Every projection is documented (scale of use, fidelity of areas, distances and angles) and adjustable. Tissot's indicatrix makes the distortions visible at a glance.
Free, open and account-free
Graticule is released as open source under the MIT licence and relies on royalty-free data. No sign-up, no installation: the tool runs in your browser.
A five-step workflow
A guided path, from framing to downloaded file.
Frame: pick a country or a region of the world from a list, or navigate the map freely to define your own extent.
Project: choose from some fifteen projections — cylindrical, pseudo-cylindrical, azimuthal, interrupted — and adjust their centring in longitude, latitude and rotation.

Customise: show the layers you need (seas and oceans, coastlines, borders, countries, relief, lakes and rivers, cities, meridians and parallels), apply a graphic theme or set your own colours.
Simplify: adjust the level of detail of the outlines, from the most detailed to the very simplified, for a reading suited to your medium.

Download: export as PNG for immediate use, or as SVG to pick up and enrich your basemap in an image editor or vector drawing application.
Play with projections
See the world differently through the projections on offer, and change their parameters to understand how they work.
Some fifteen documented projections
From Mercator to Bertin 1953, by way of Equal Earth, Atlantis, interrupted Mollweide or Satellite — each with a note explaining its history, its uses and its trade-offs.
Three criteria, at a glance
For every projection, the fidelity of areas, distances and angles is indicated, along with the recommended scale of use (global, regional or local).
Tissot's indicatrix
Display the distortion ellipses to see immediately where and how the projection stretches, compresses or rotates the Earth's surface.
Free centring
Slide the world from east to west, tip it from north to south or rotate it. Off-centring a map already changes what it says.
Example outputs
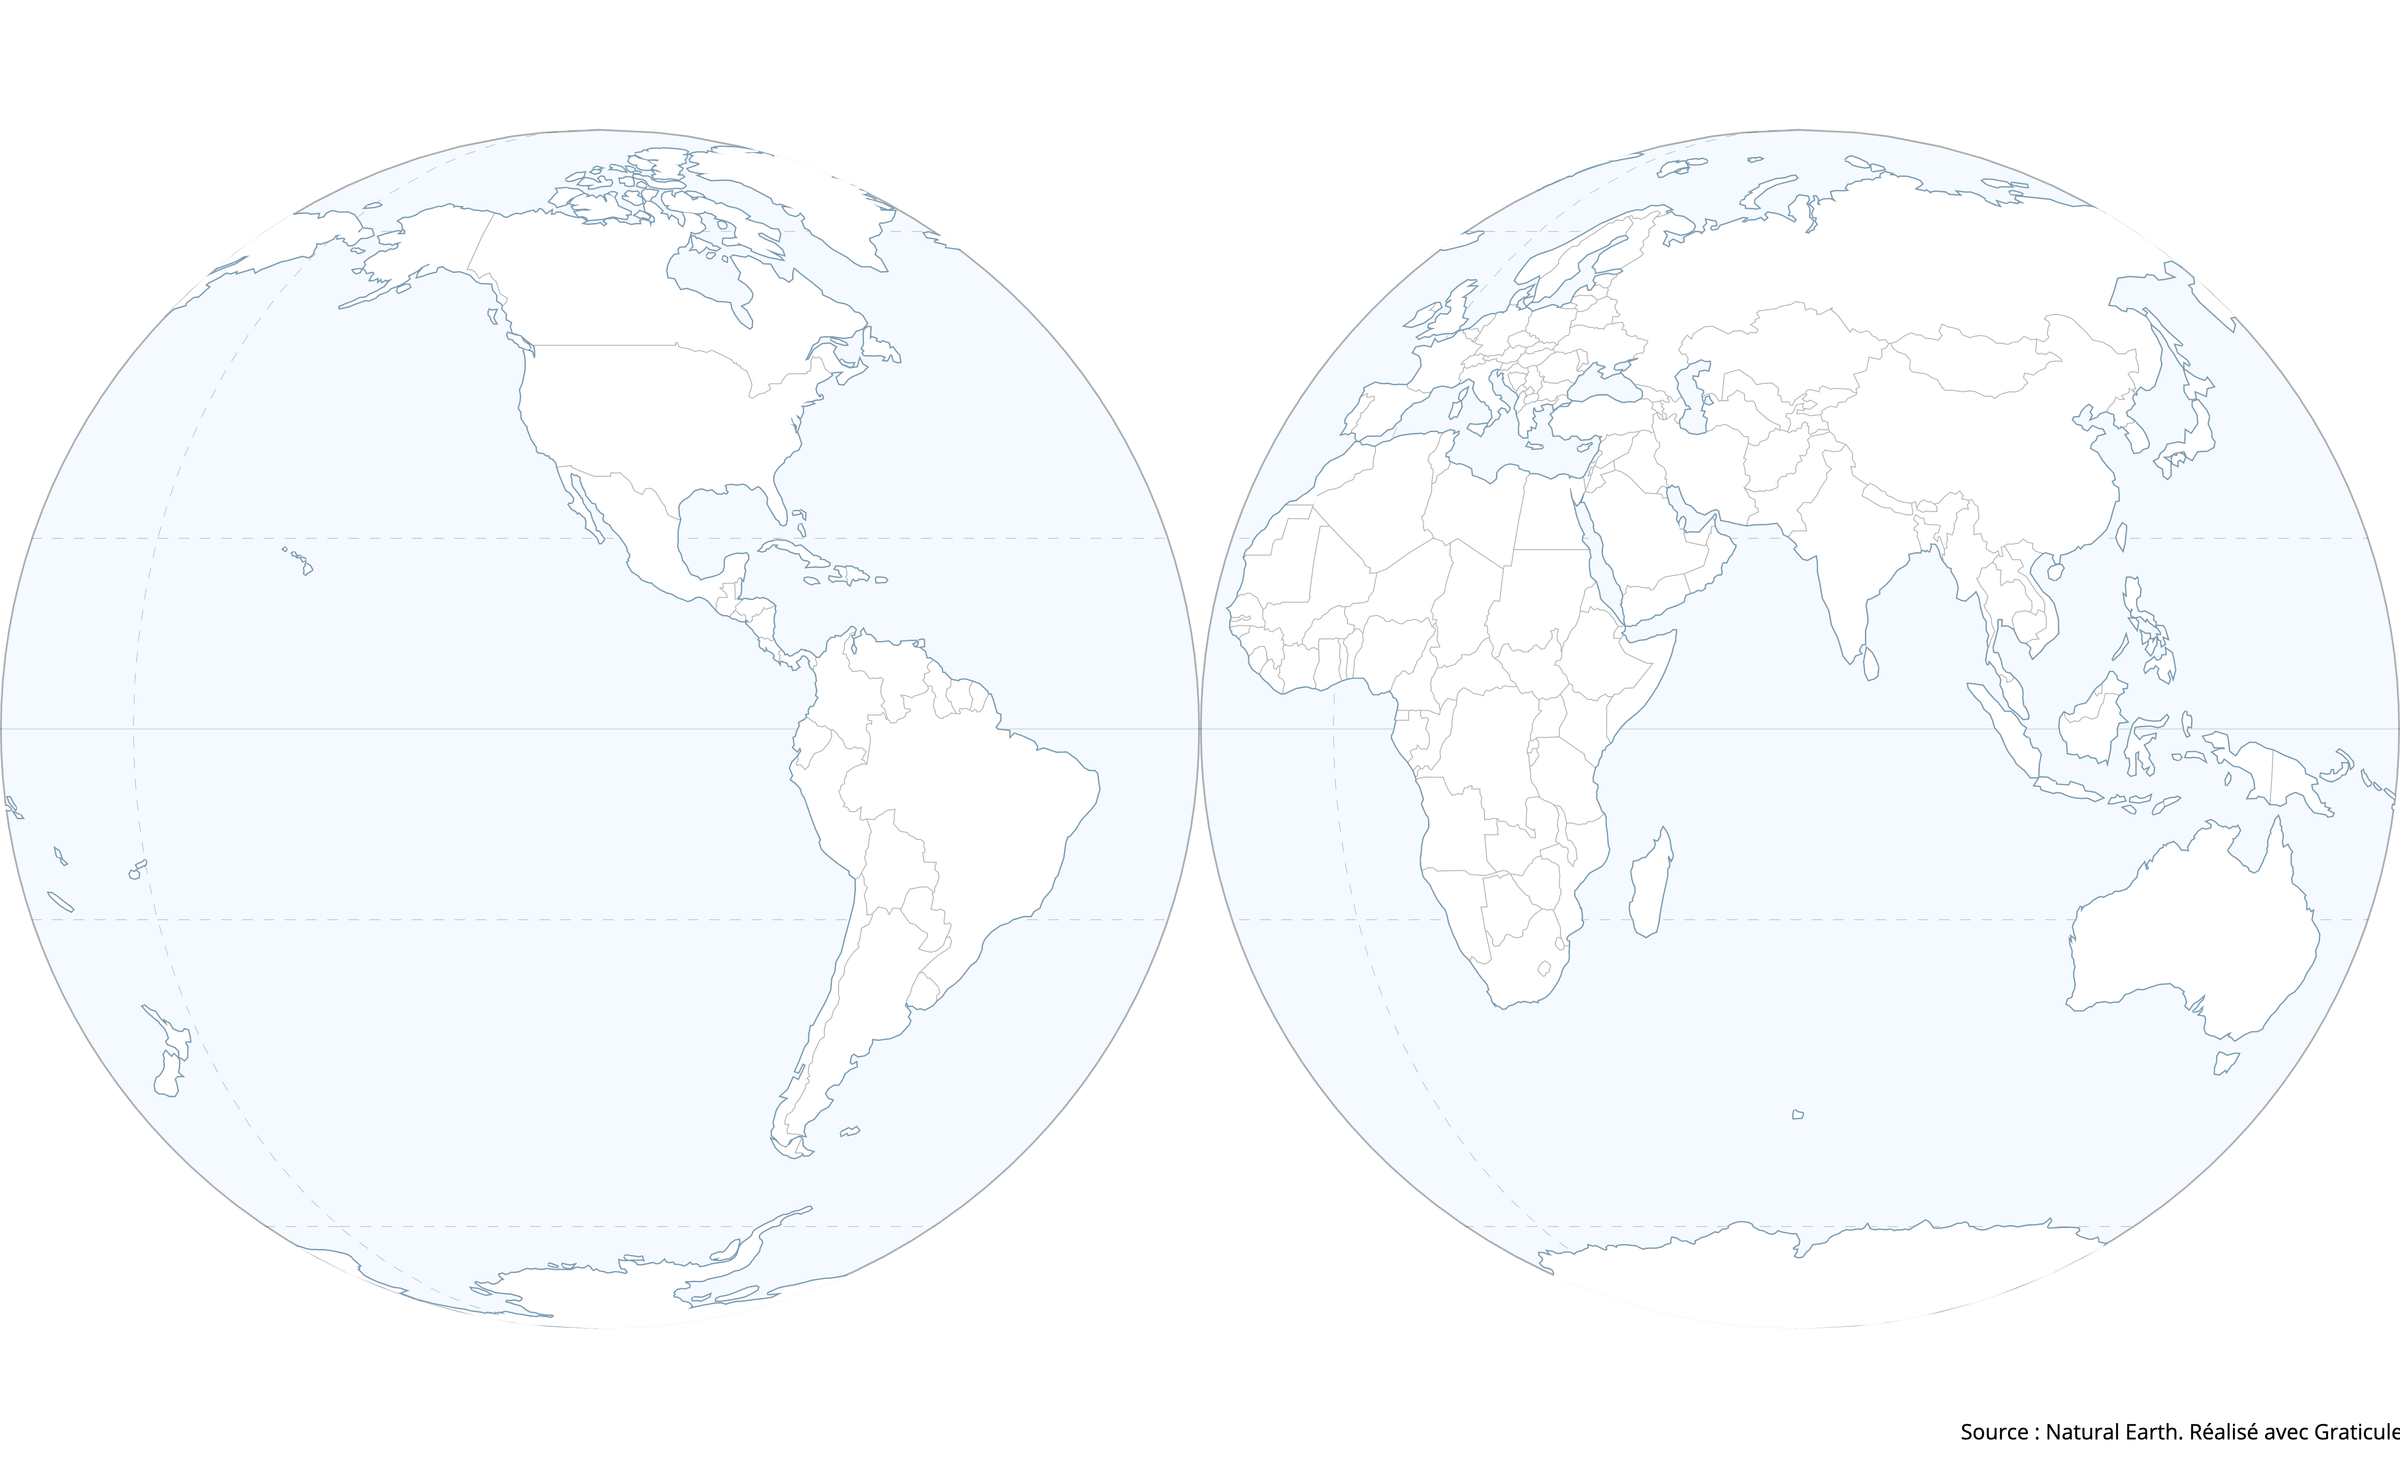
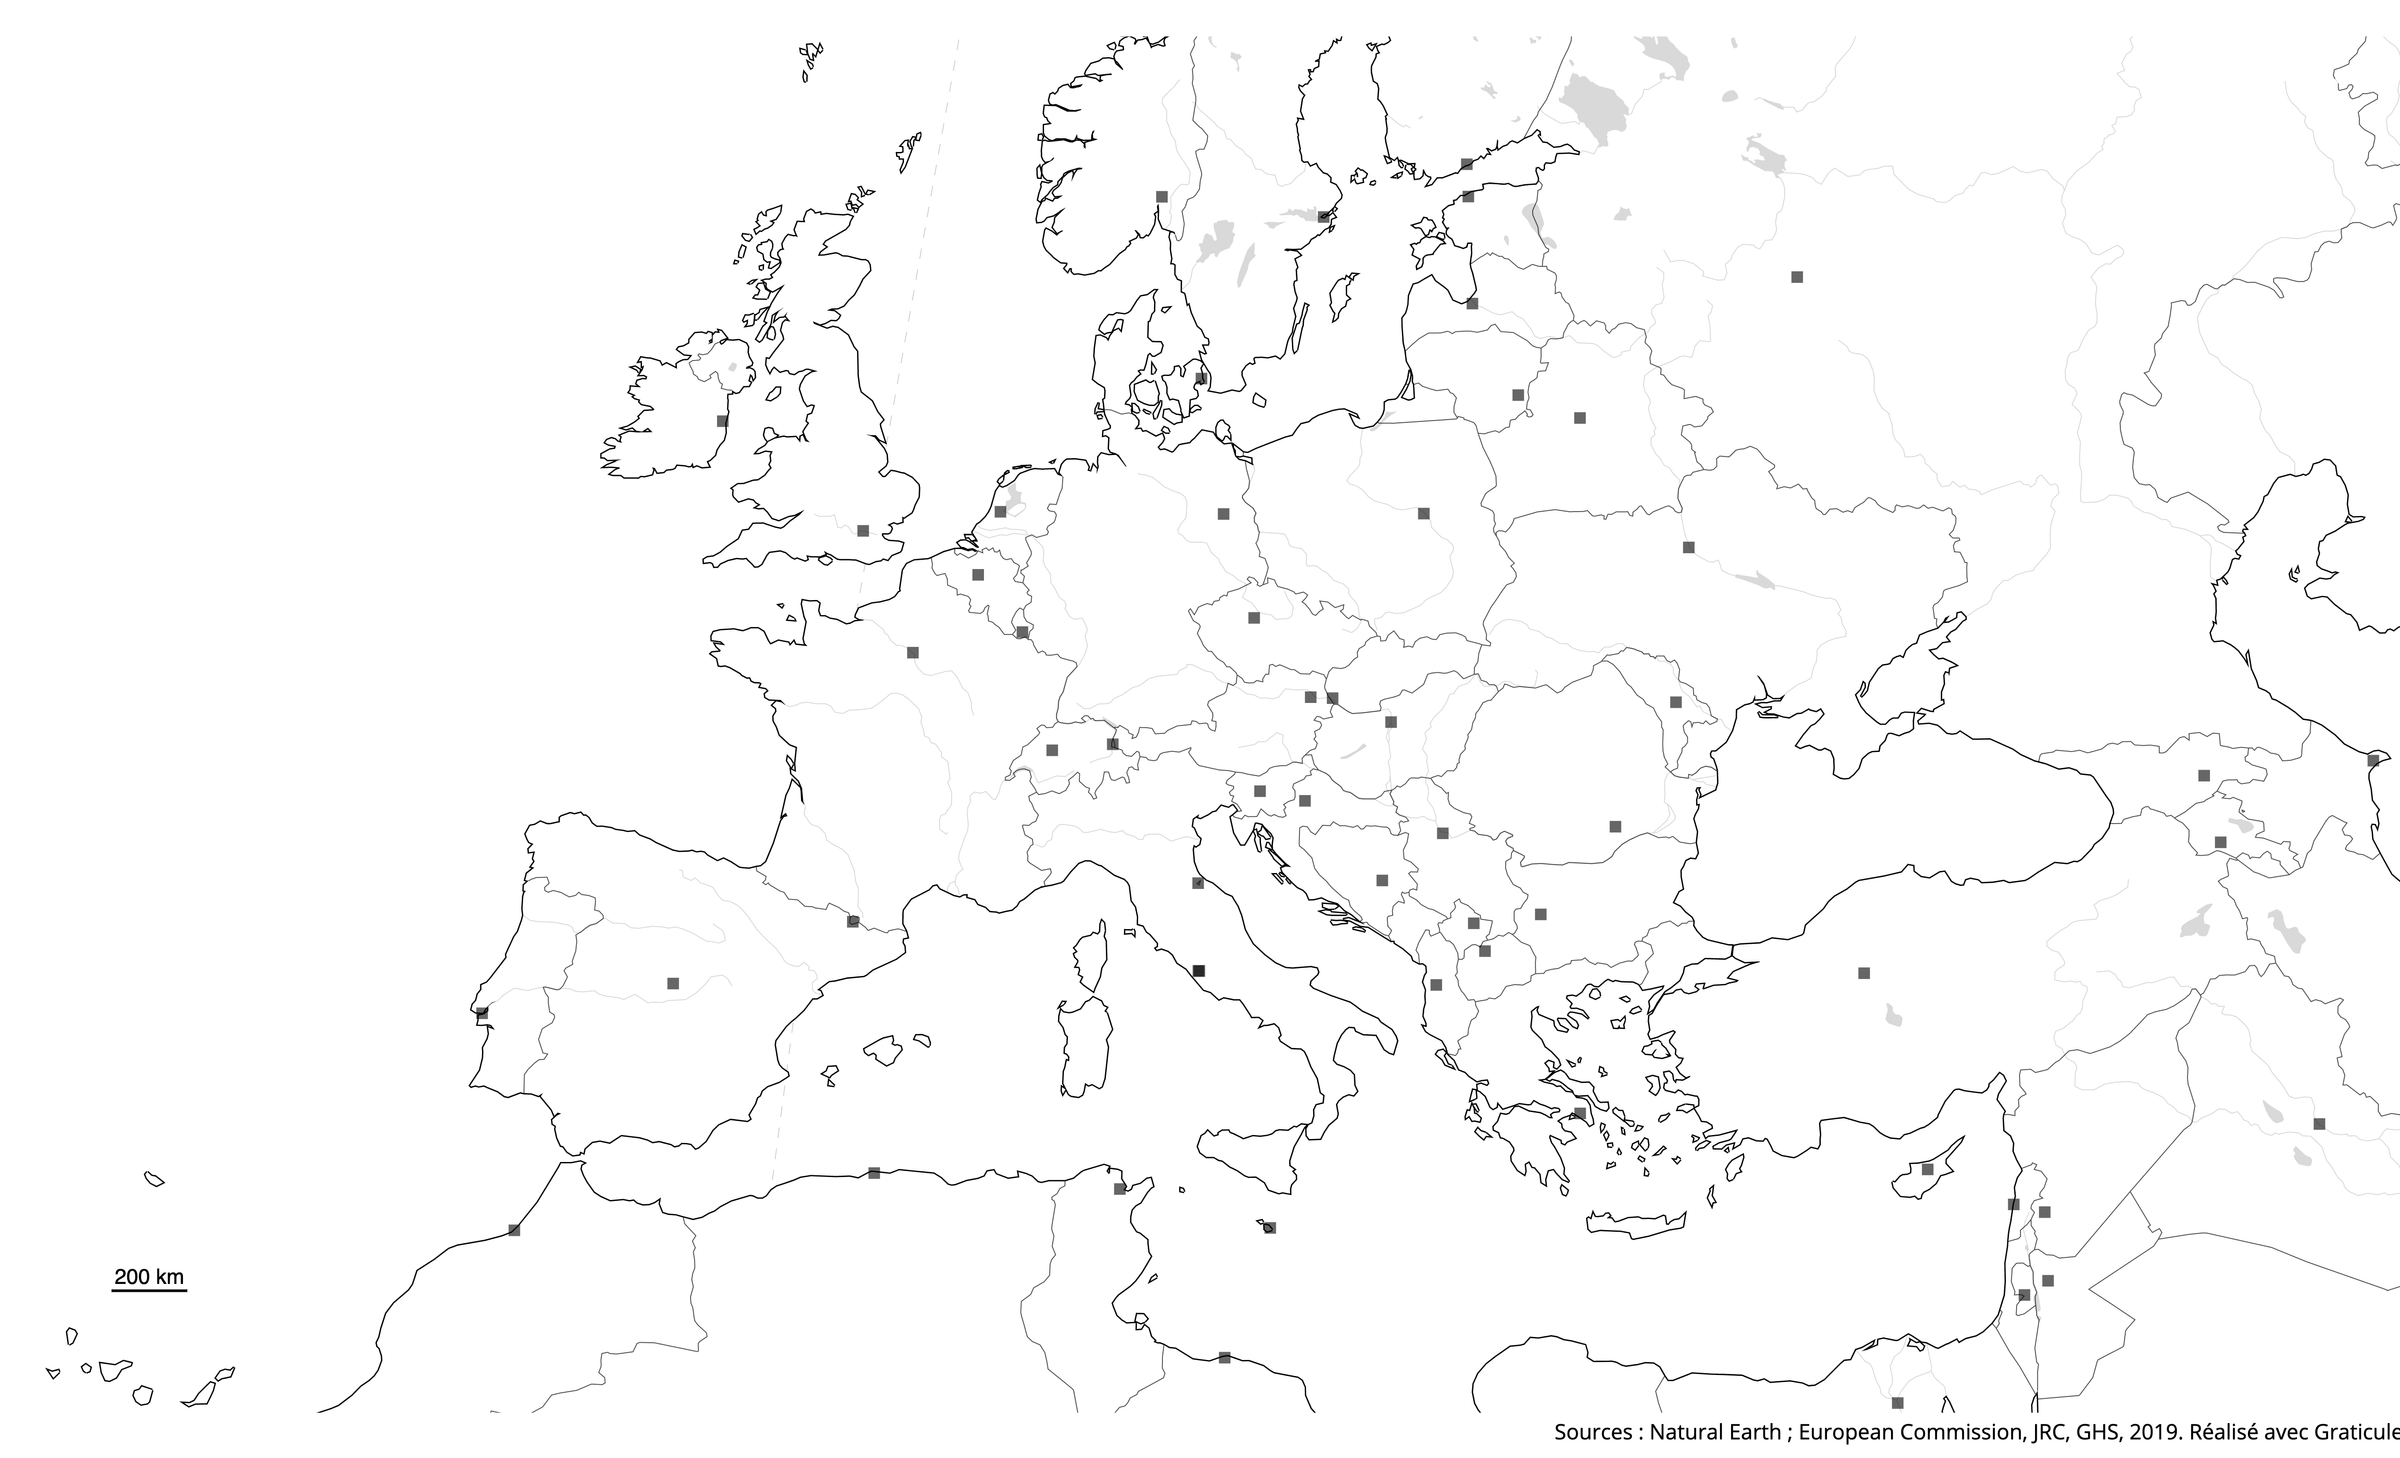
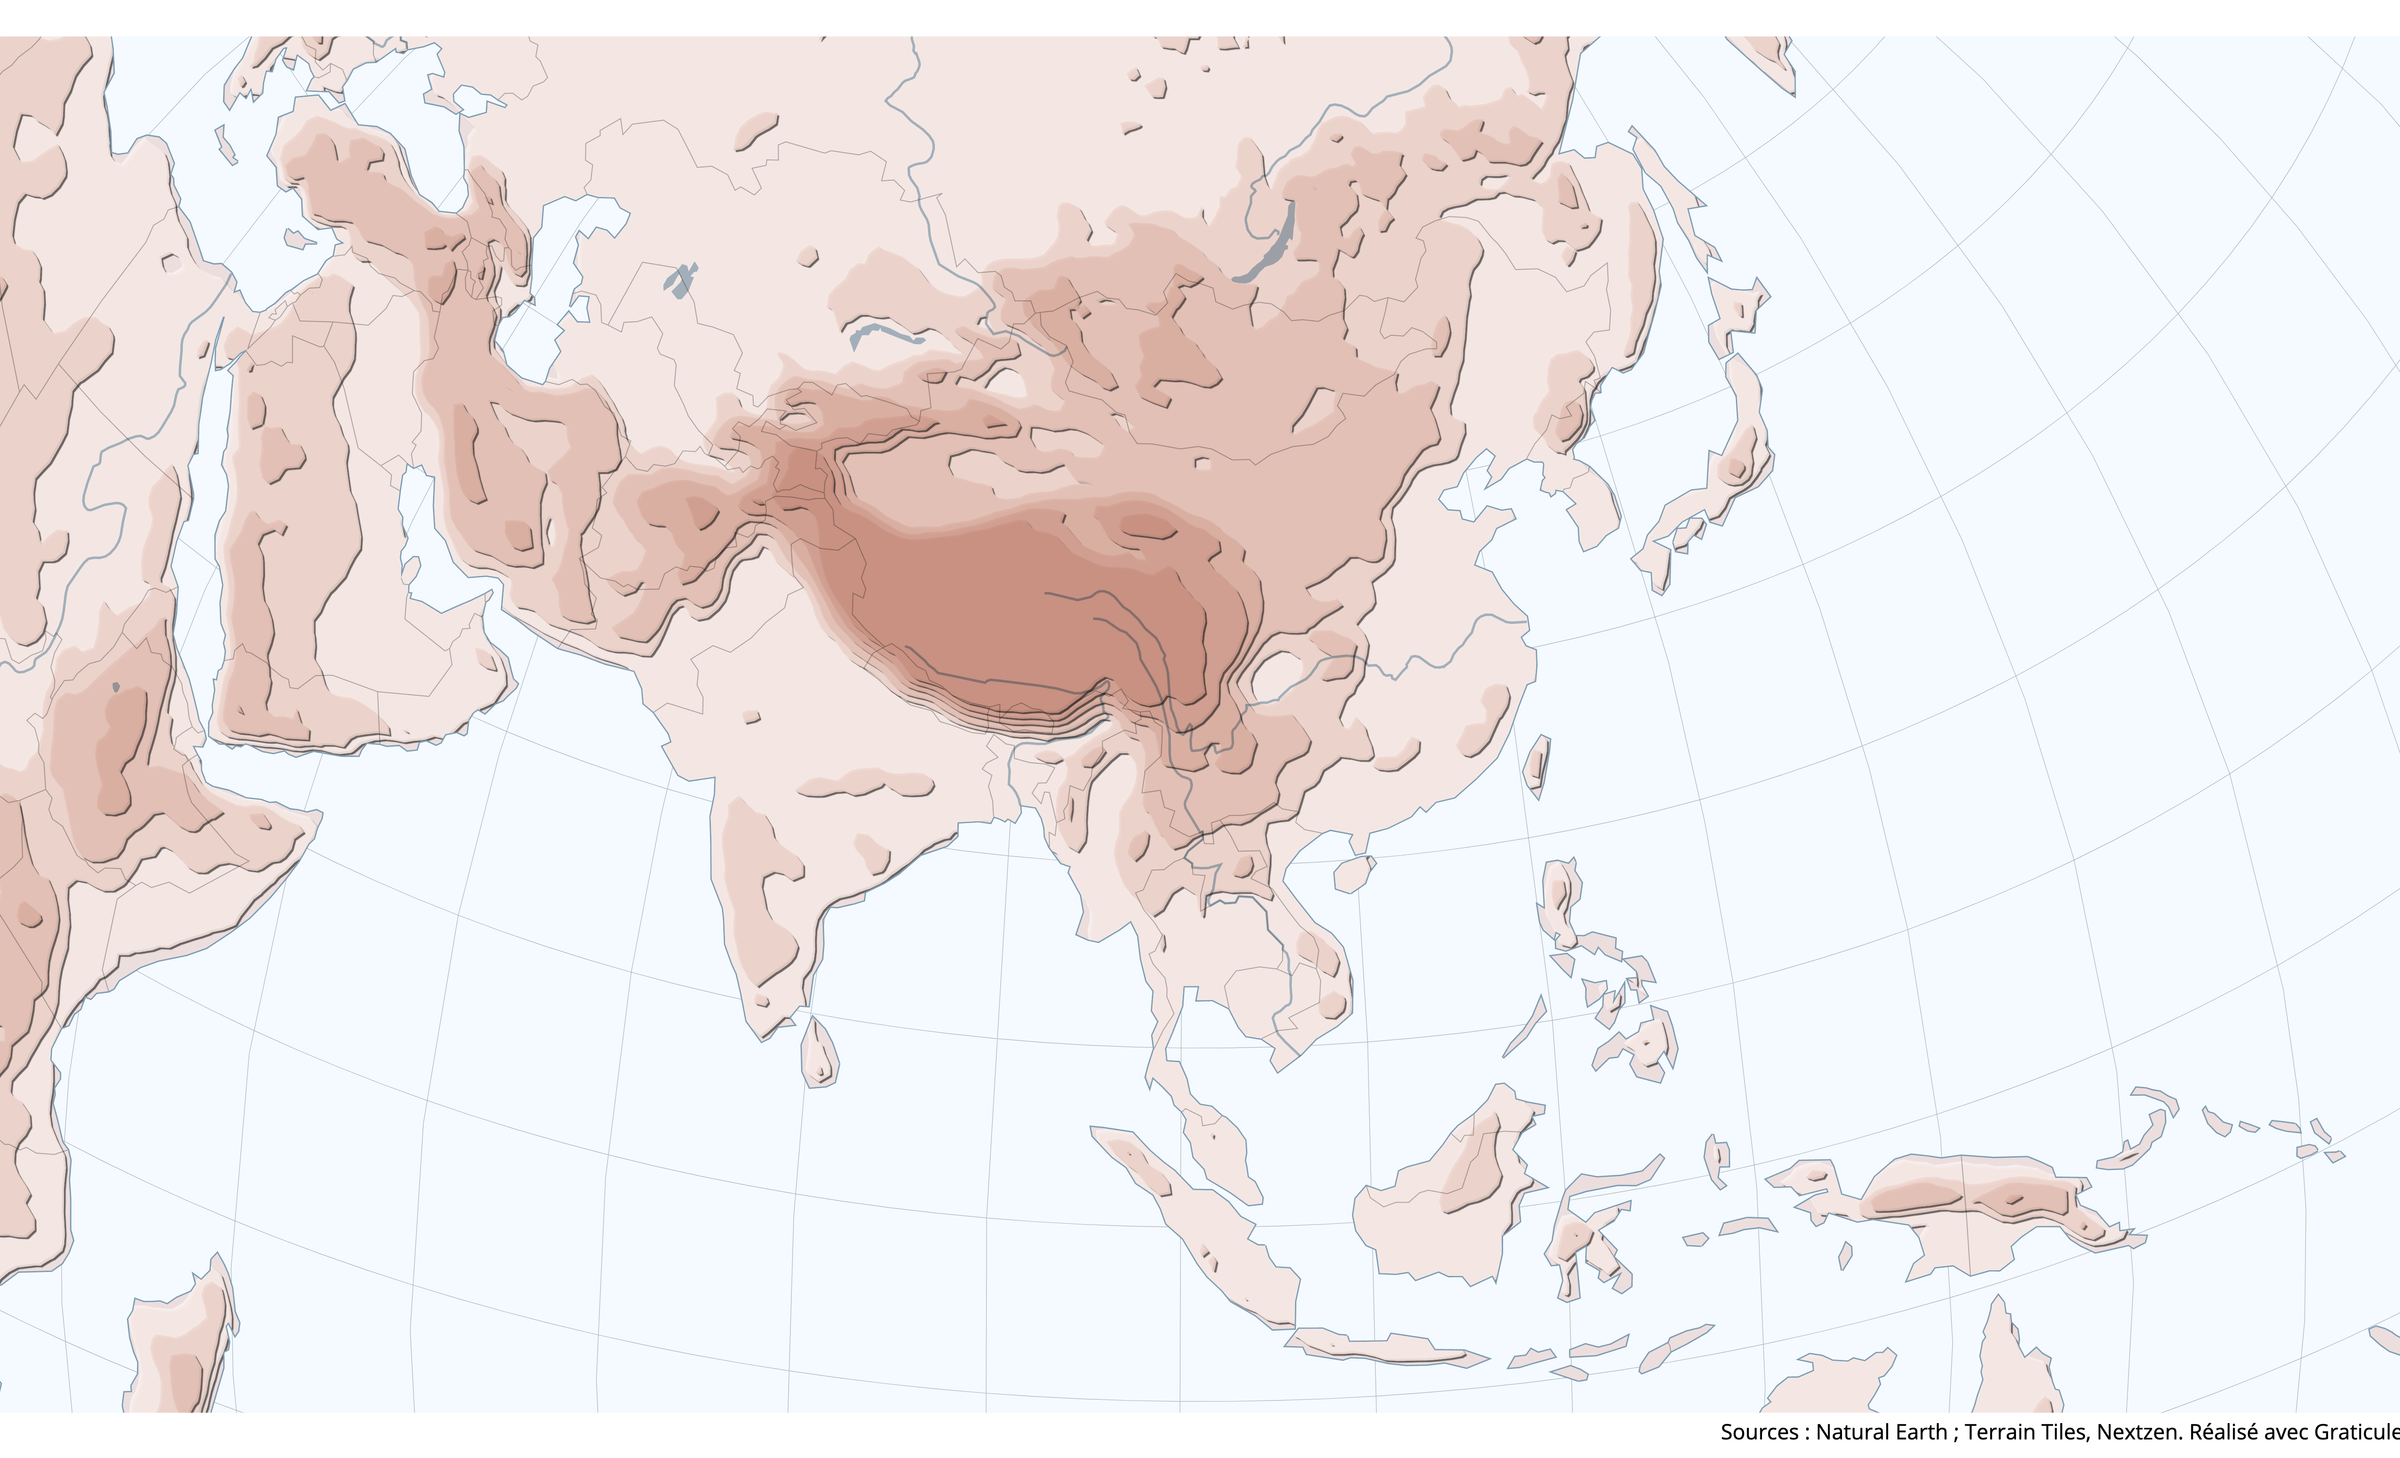
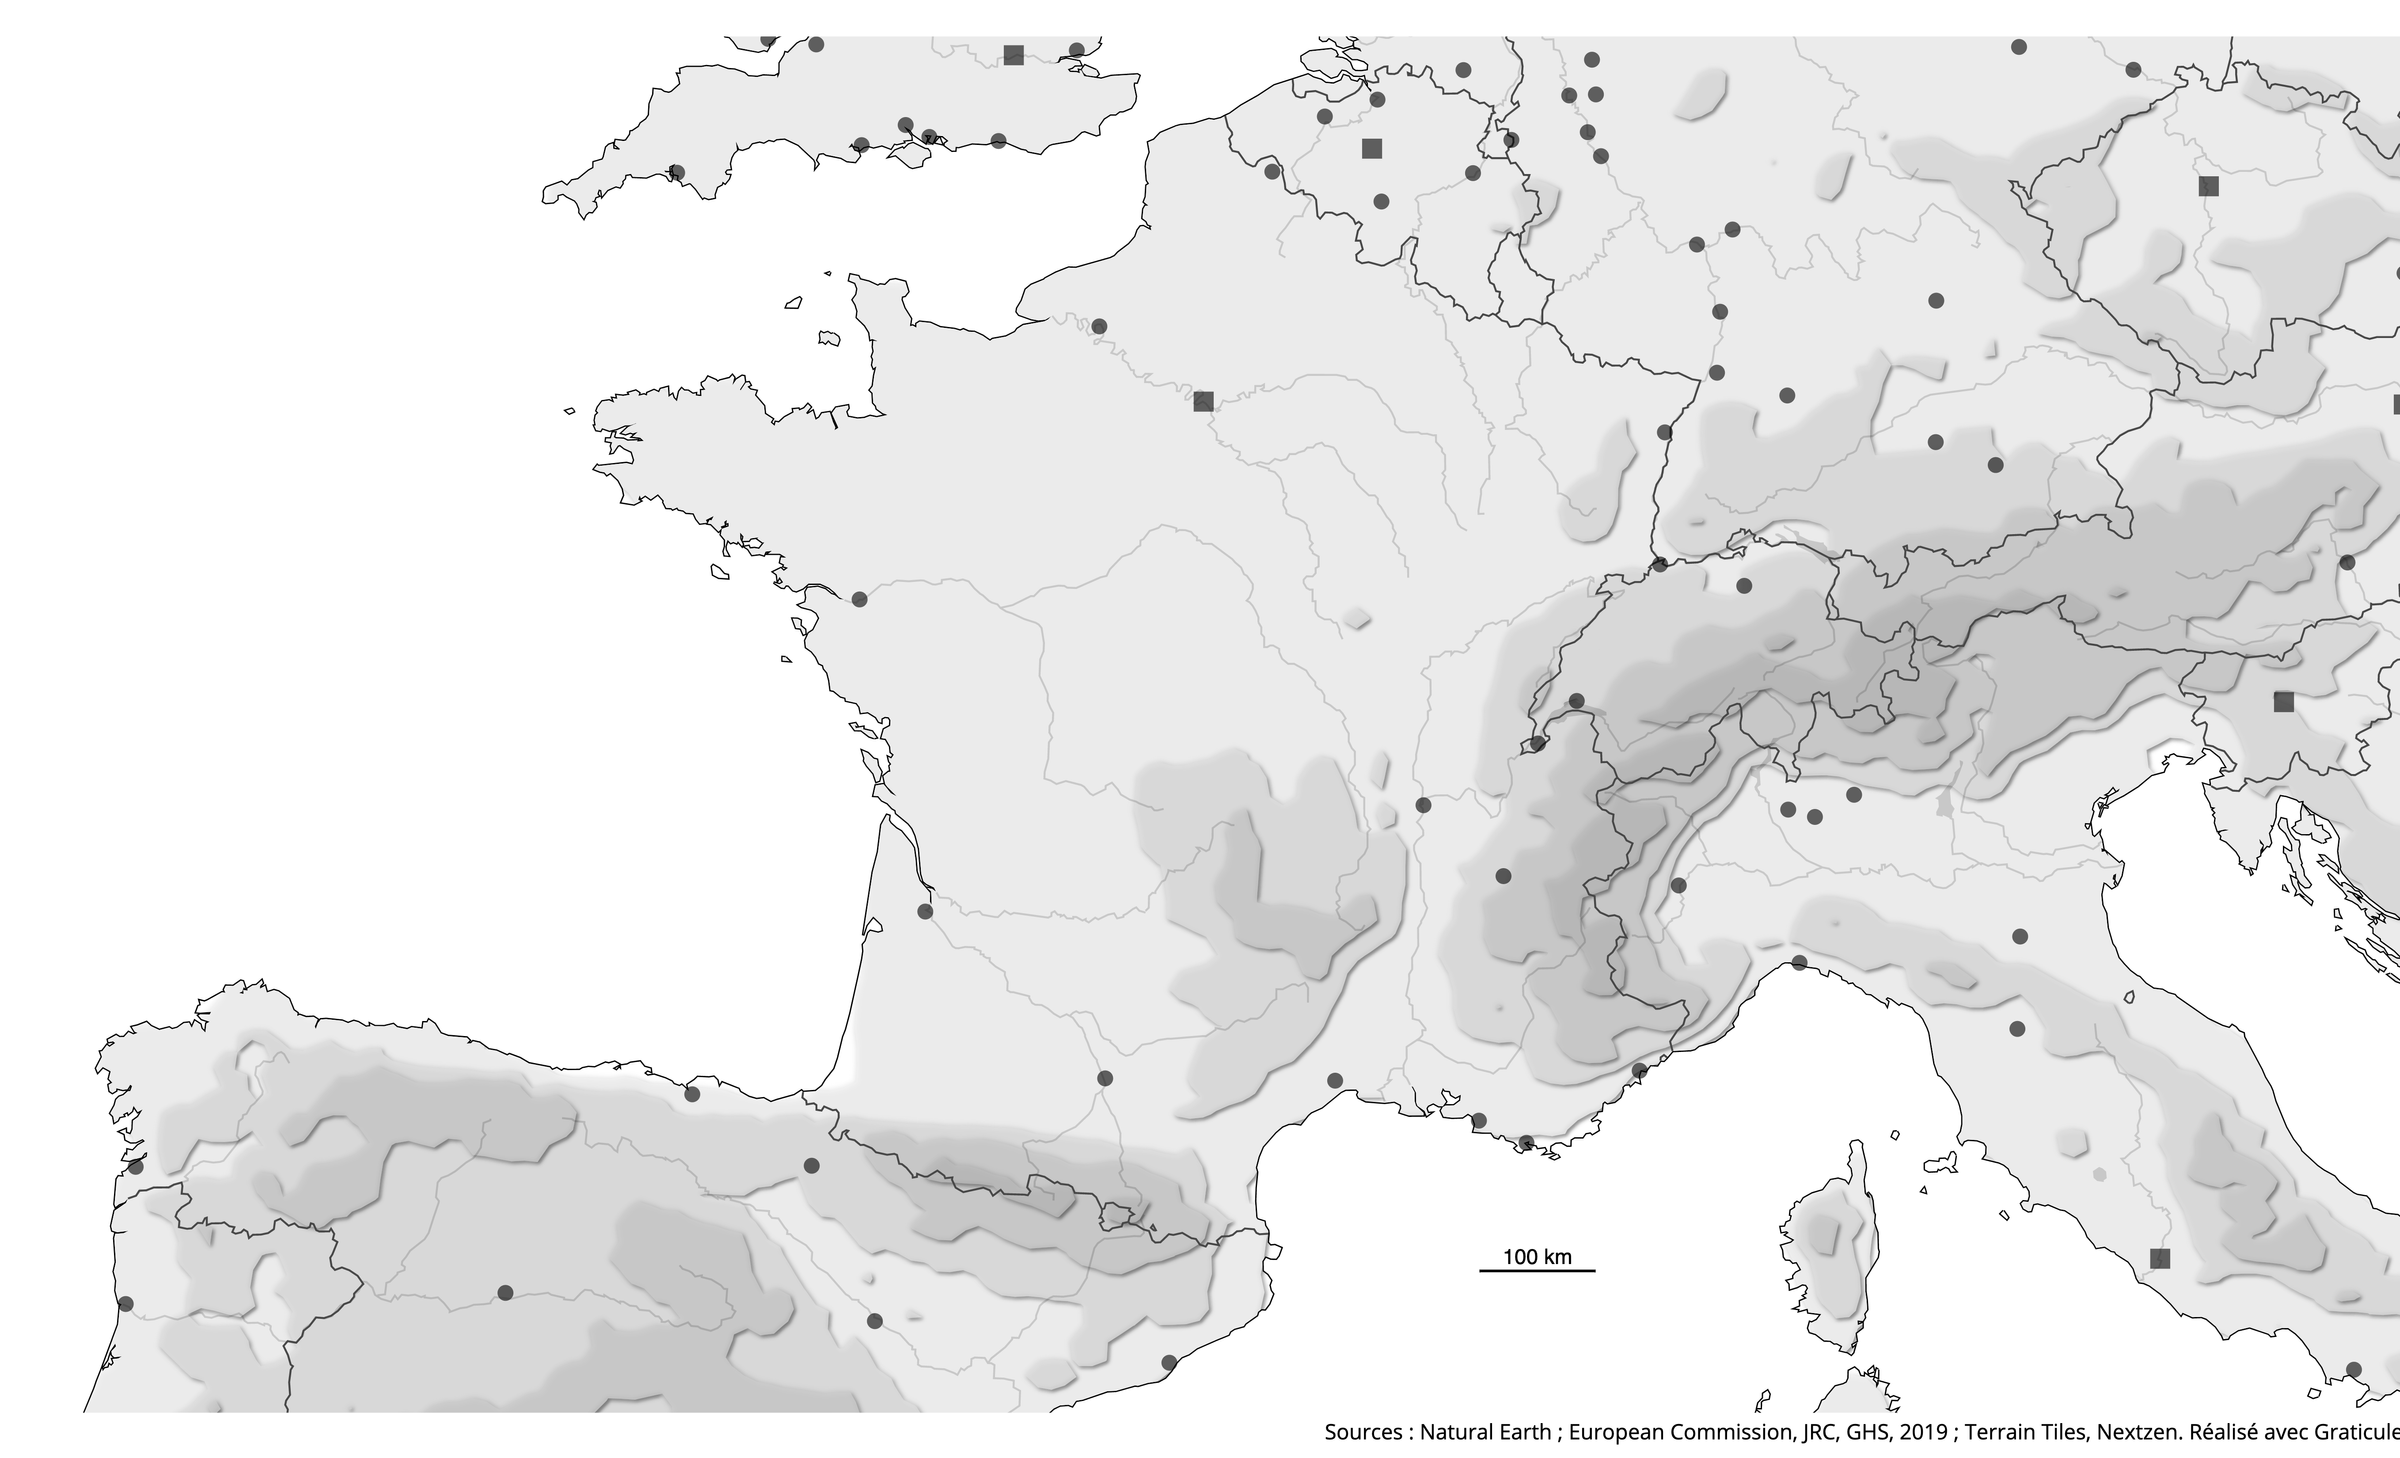
A few basemaps to download, to get a sense of the range of possible results.
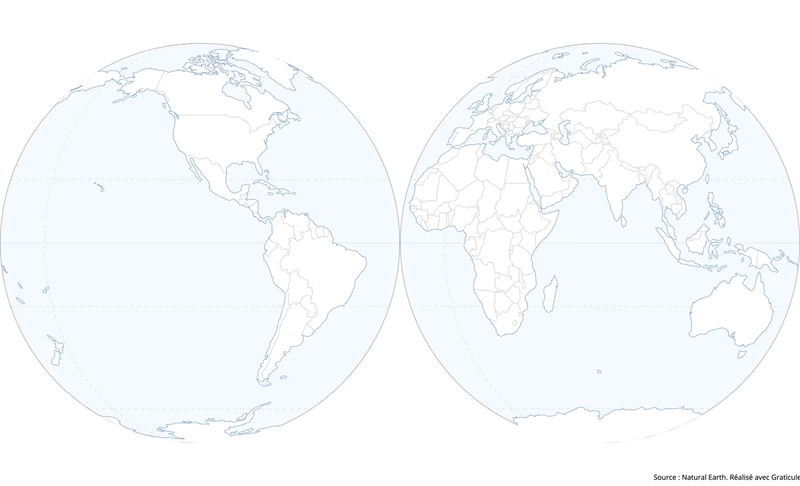
The world in two hemispheres

Europe with capital cities

Physical Asia

France with relief and major cities
FAQ
What is Graticule for?
Producing a basemap for a geography sketch, discovering and handling map projections, putting graphic design notions to work. The uses and the audiences can be very varied. Our aim with Graticule is to offer a free, simple tool that introduces any kind of audience to cartography and its concepts.
Can I import and display data?
No — Graticule only produces basemaps. A few elementary pieces of information are available inside the tool and can be added to the basemap. It is therefore not a thematic mapping tool. For that, we invite you to use Khartis, which makes thematic maps straightforward.
Can the basemaps be used in GIS software?
No — exports from Graticule are meant for print or for editing in an image editor or vector drawing application. The data used in the tool is nonetheless freely available from the providers listed in the sources, so you can download it and work with it in the software of your choice.
May I use a Graticule basemap commercially?
Yes. Graticule is open source and uses royalty-free data that allows any kind of use, commercial included. The sources shown at the foot of the map must however be kept on your final map. The “made with Graticule” credit is optional, but keeping it is a form of support that remains very welcome!
Which data sources are used?
Graticule uses open-access, royalty-free sources. The providers of that data are listed at the foot of the basemap, according to the information displayed.
Who is behind Graticule?
The Sciences Po Cartography Workshop designed and developed Graticule. Founded in 1995, the Workshop contributes to teaching, produces educational and scholarly material, takes part in research projects and publications, and experiments with visualisation tools. In doing so it serves Sciences Po's mission of producing and sharing knowledge that sheds light on contemporary issues and feeds public debate. With Graticule, the Workshop hopes to offer a teaching tool aimed chiefly at pupils and students, as well as at teachers.
What is a graticule?
It is a graphic representation in the form of a grid, made up of meridians and parallels, which lets you visualise a coordinate system and better appreciate a map projection. It also makes a very good name for an application!