Credit : BNF, département Cartes et plans, GE C-3677, Carte générale des différents tracés étudiés par ordre de la Direction générale des Ponts et Chaussées pour l’établissement du chemin de fer de Paris à Rouen, au Havre et à Dieppe, avec embranchements secondaires sur Beauvais, Gournay, Meulan, Louviers, Elbeuf, Neufchatel, Fécamp, Montivilliers et avec le railway des frontières du Nord par Creil.
Which framing to choose?

Benoît Martin
Published 18/09/2024
Note to readers:
This article is part of a set of methodological resources dealing with the map exercise required in the Thinking IR Globally course at Sciences Po. The “map” is essentially identical to the “geographical sketch” used french in high school. Most of the points developed in these resources apply to secondary education.
Answer to a given topic
The aim of drawing a map in the Thinking IR globally course is to produce a response that is:
- well-argued and original – as with a presentation or essay, you must therefore define the terms, put forward arguments, and illustrate them (with examples, indicators, etc.);
- and geographical – this is the specific feature of maps. The following paragraphs show that the base map requires several choices to be made.
However, the exercise allows an amount of flexibility: the shape of the map must be adapted to serve the argument, not the other way around. For example, you can zoom in on a location, or even cut, connect, or duplicate the base map to compare two territories or two periods. Similarly, a diagram, graph, or timeline can sometimes usefully complement a strictly geographical representation.
Choose the good scale level
Zoom level. The Thinking IR globally course focuses primarily on the global scale, but a topic can be addressed on a regional or even local scale if relevant. This choice of scope is very important in the answer: for example, the topic of “Japan’s strategic environment” can be addressed in its immediate neighborhood or on an Indo-Pacific scale; the issues highlighted will not necessarily be the same.

Picture 1. Three options of framing on Japan.
The information on the base map. This should be chosen according to the topic. For example, when mapping “Tourists as actors in international relations”, the state grid is not mandatory: coastlines (continental continuity, distinction between seas) or other structural elements (cities, climate zones, flows, etc.) are more relevant.
Choose a projection and center
A planisphere does not necessarily have to be rectangular, nor does Europe have to be at the center of the world!
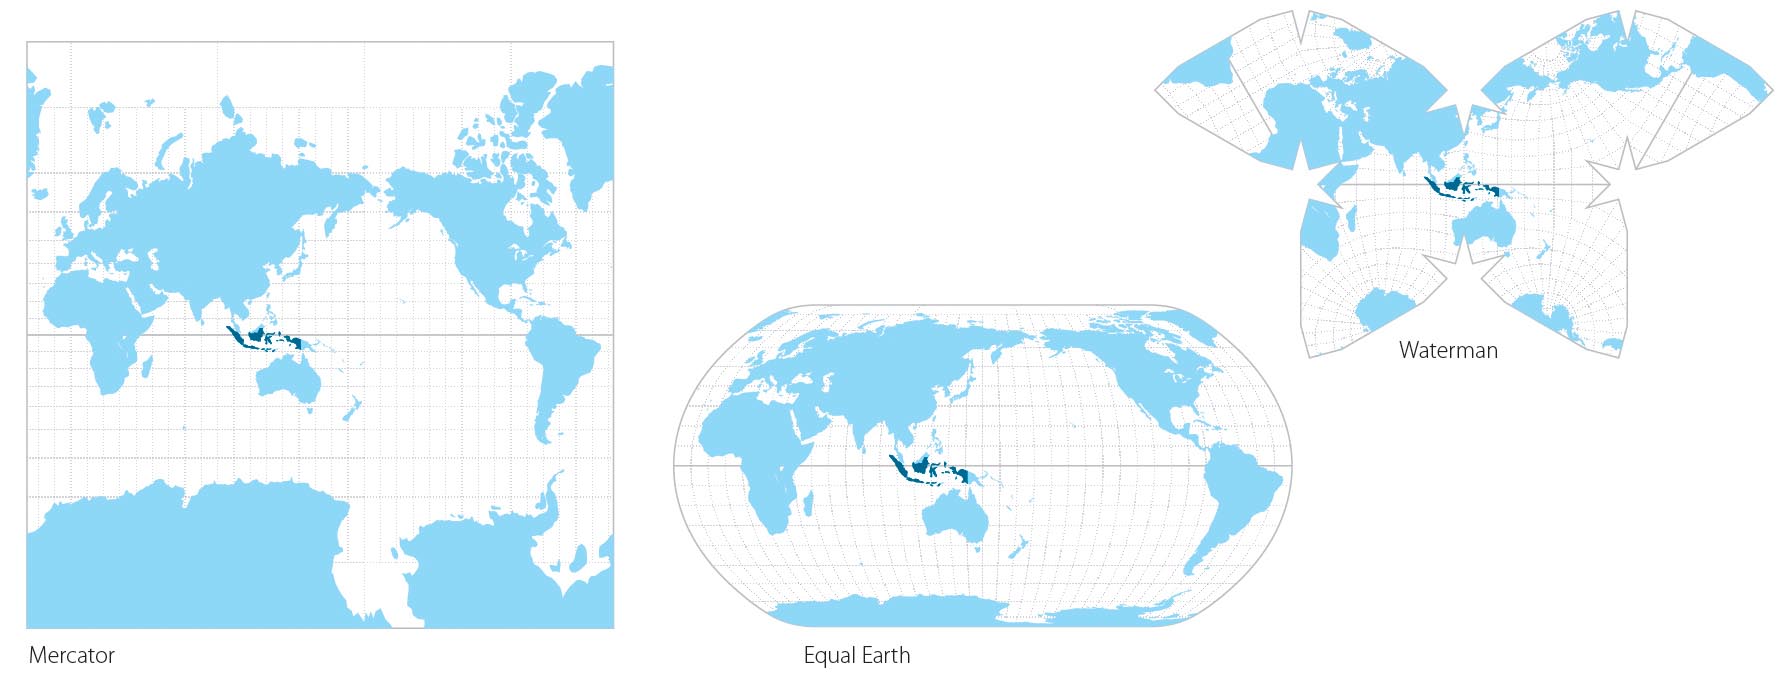
Shape. On a global scale in particular, the choice of projection determines the cartographic discourse. In the Thinking IR globally course, some widely used projections should be avoided (Mercator exaggerates high latitudes too much), while others facilitate the drawing of lines between continents (Buckminster-Fuller) or retain a more “classic” shape (Natural Earth or Bertin 1950).
Centering. The same projection can show different points of view. The subject or area under study is generally placed in the center of the map for reasons of perception (center/periphery) and practicality (drawing); this is shown in the example below with the subject “Indonesia: An Islamic Power?”
The tool Graticule allows you to choose, modify, and then export map backgrounds.

Picture 2. Three map projections centered on Indonesia]
To go further
- All the articles to Getting started with cartography in Thinking IR globally
